Derek Eder
Civic Tech Builder

I use data, build tools, and organize people in Chicago to democratize power. Read more »
 DataMade
Founder and Partner
 Village of Oak Park
Trustee
 Chi Hack Night
Co-Founder and President Emeritus
Wanna talk? Email me
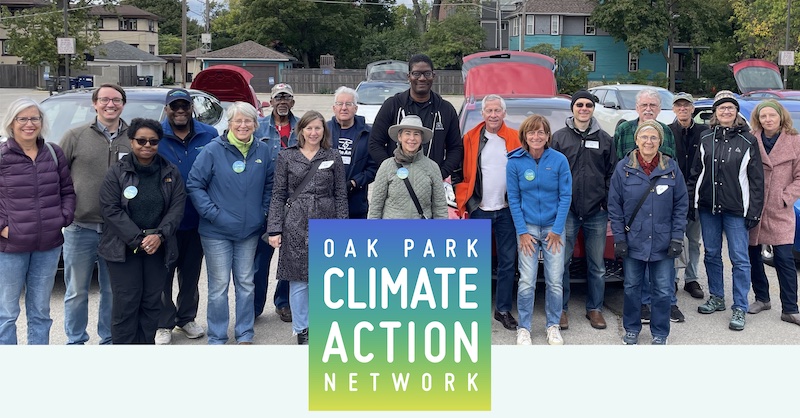
Oak Park Climate Action Network
https://opcan.org
Squarespace website for a volunteer group of Oak Park, Illinois, residents working to eliminate our community’s contribution to the global climate crisis through equitable policies and practices.
Illinois Solar Map
https://ilsolarmap.com
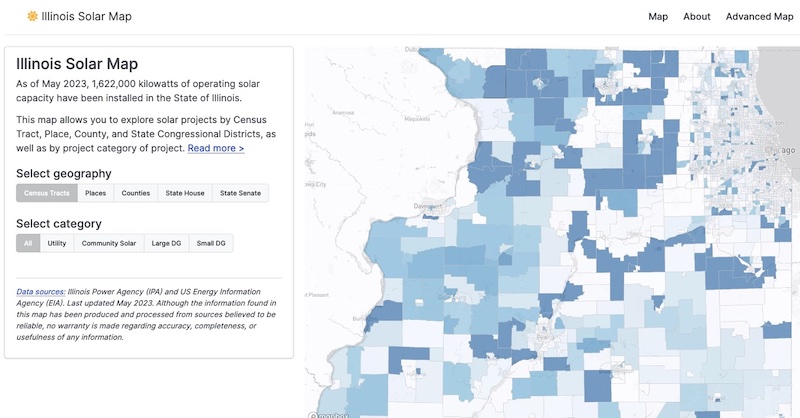
As of May 2023, 1,622,000 kilowatts of operating solar capacity have been installed in the State of Illinois thanks to the Climate and Equitable Jobs Act (CEJA). The Illinois Solar Map allows you to explore solar projects by Census Tract, Place, County, and State Congressional Districts, as well as by category of project.
Decarb My State
https://decarbmystate.com
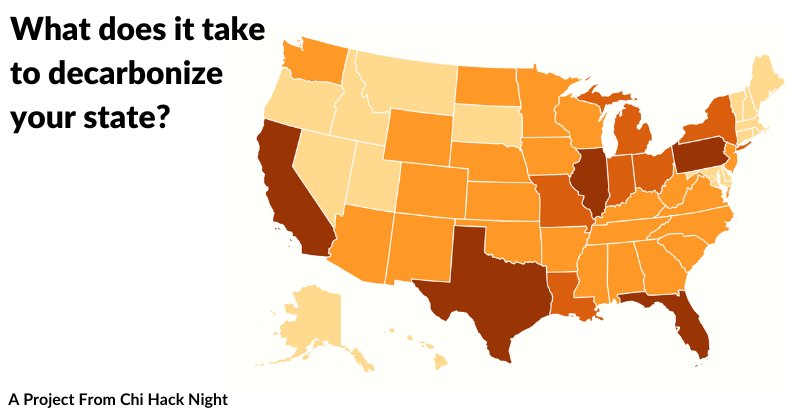
With volunteers at Chi Hack Night, we pulled together emissions and electrification data for all 50 states + DC and organize it based on the biggest sources of climate pollution: the machines we use to heat our homes, cook our food, get us places, and produce our power. We count and name every coal, gas and oil plant that needs to close, track how many of our buildings and cars have been electrified, and how much wind and solar has been built.
Budget: Oak Park
https://budgetoakpark.com
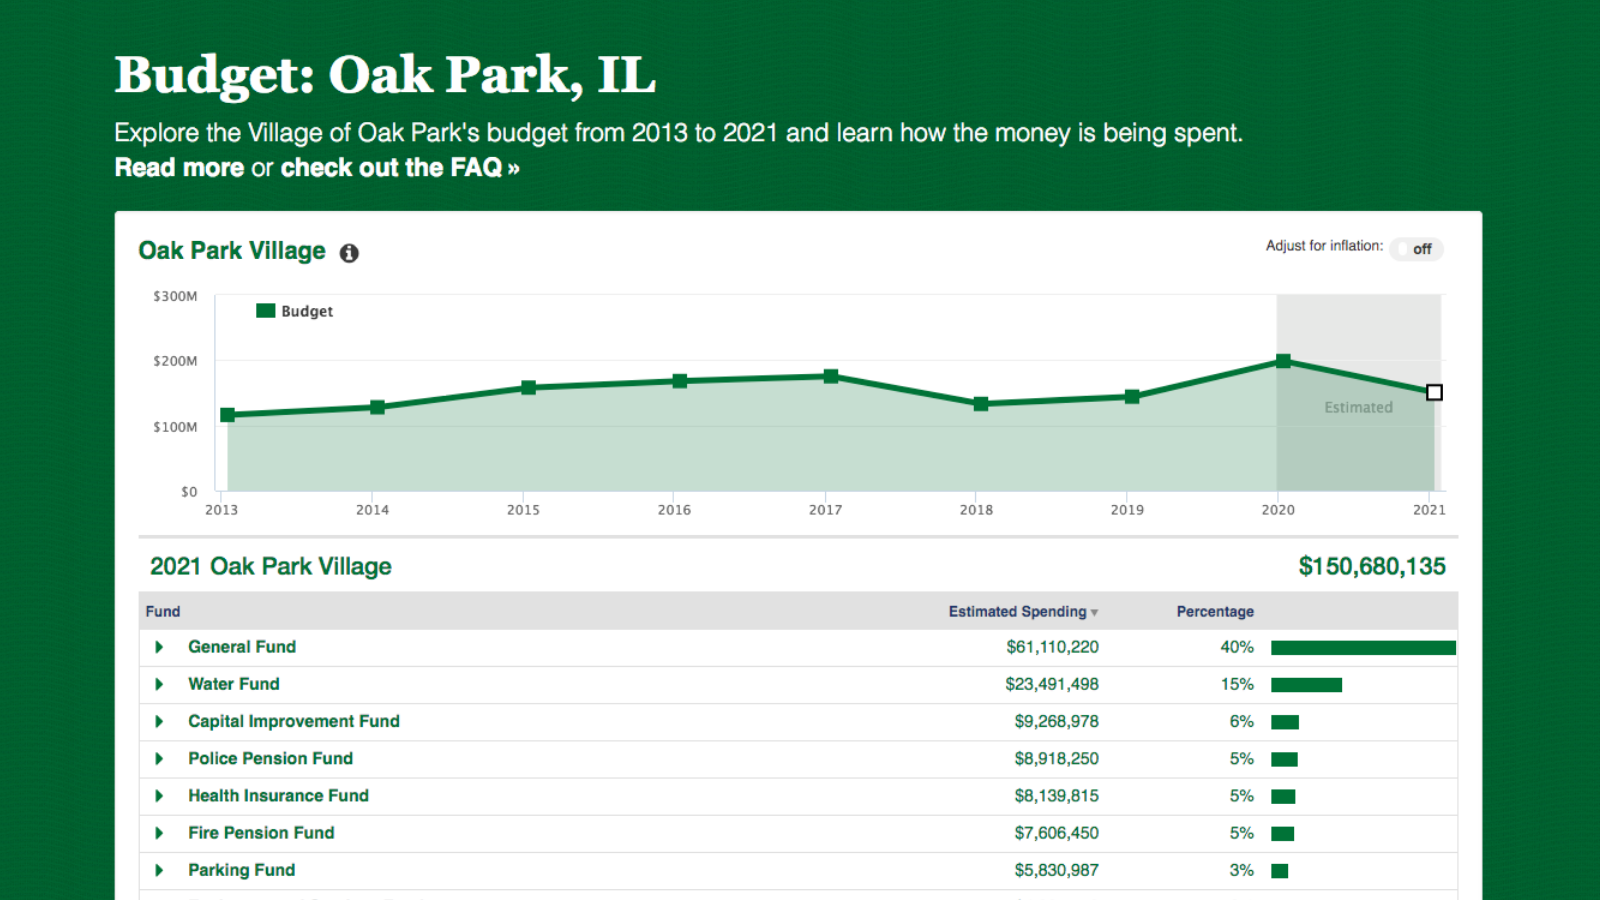
Budget: Oak Park is a budget transparency tool for the Village of Oak Park, Illinois. It was built by Oak Park Residents Derek Eder (Partner, DataMade) and Alicia Chastain. It is not an official application from the Village. By extracting data from the Village’s official budgets from 2017, 2019 and 2021, we were able to display and compare annual budgets from 2013 through 2021.
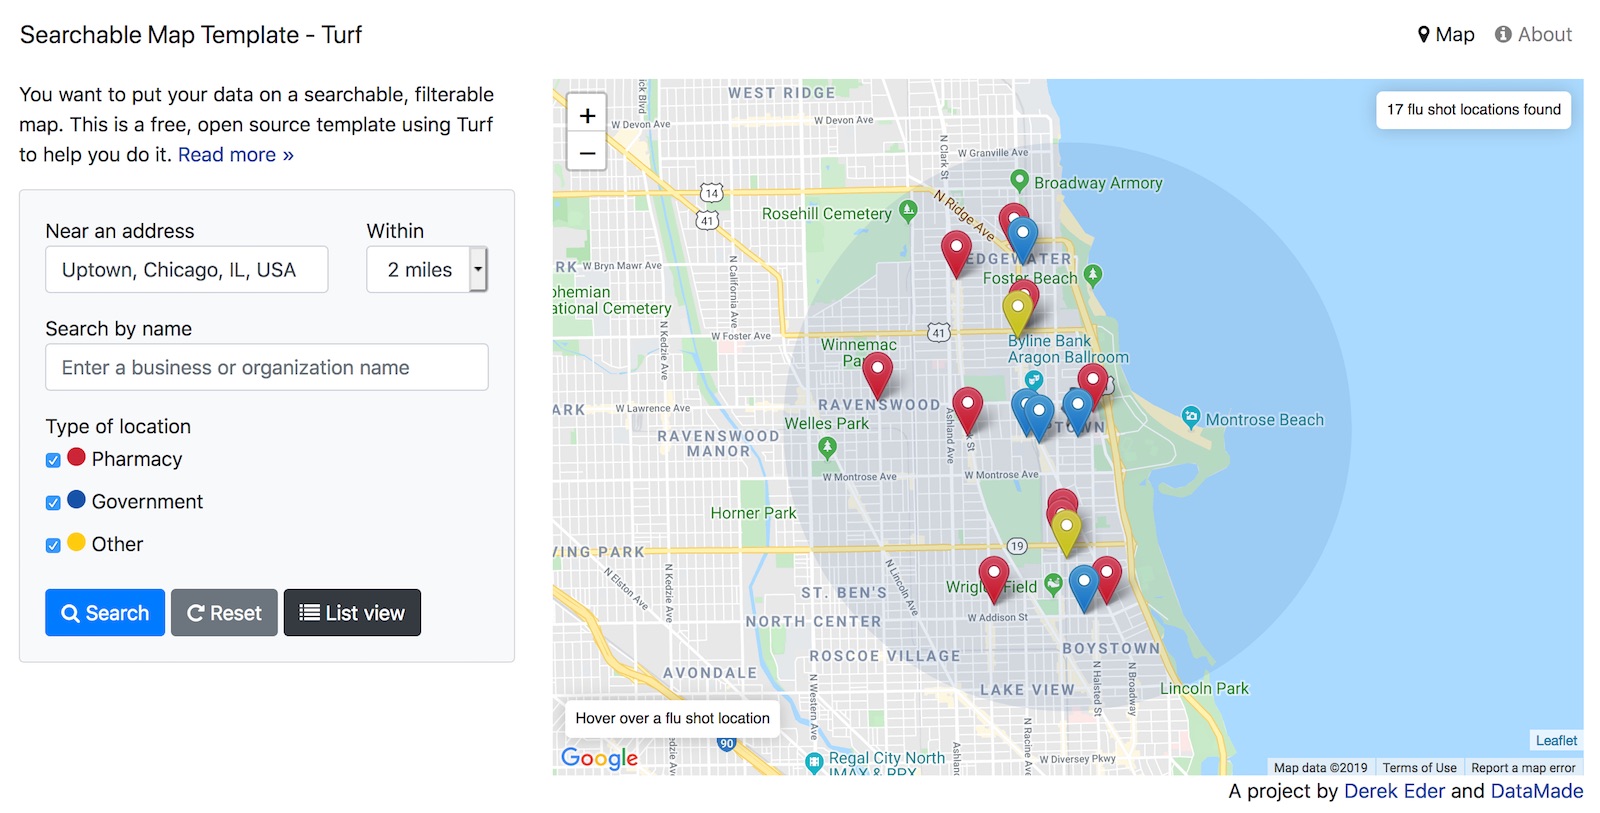
Searchable Map Template - CSV
https://github.com/datamade/searchable-map-template-turf
Put your data on a searchable, filterable map. This is a free, open source tool and template powered by javascript in the browser using Leaflet and Turf.js.
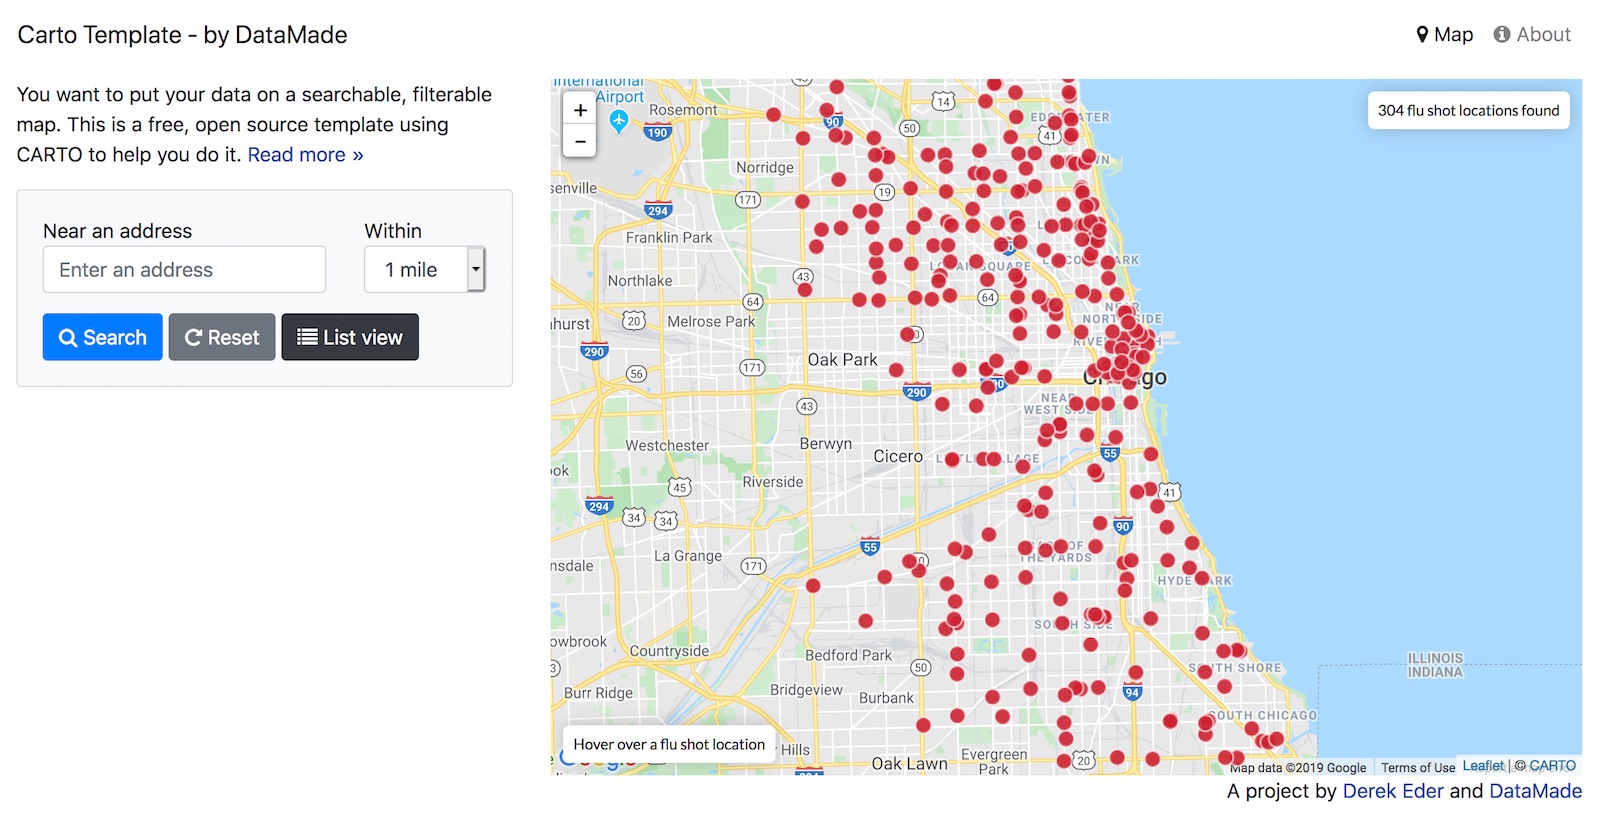
Searchable Map Template - Carto
https://github.com/datamade/searchable-map-template-carto
For more heavy duty data mapping, I made a template that uses CARTO, a paid mapping platform similar to Fusion Tables.
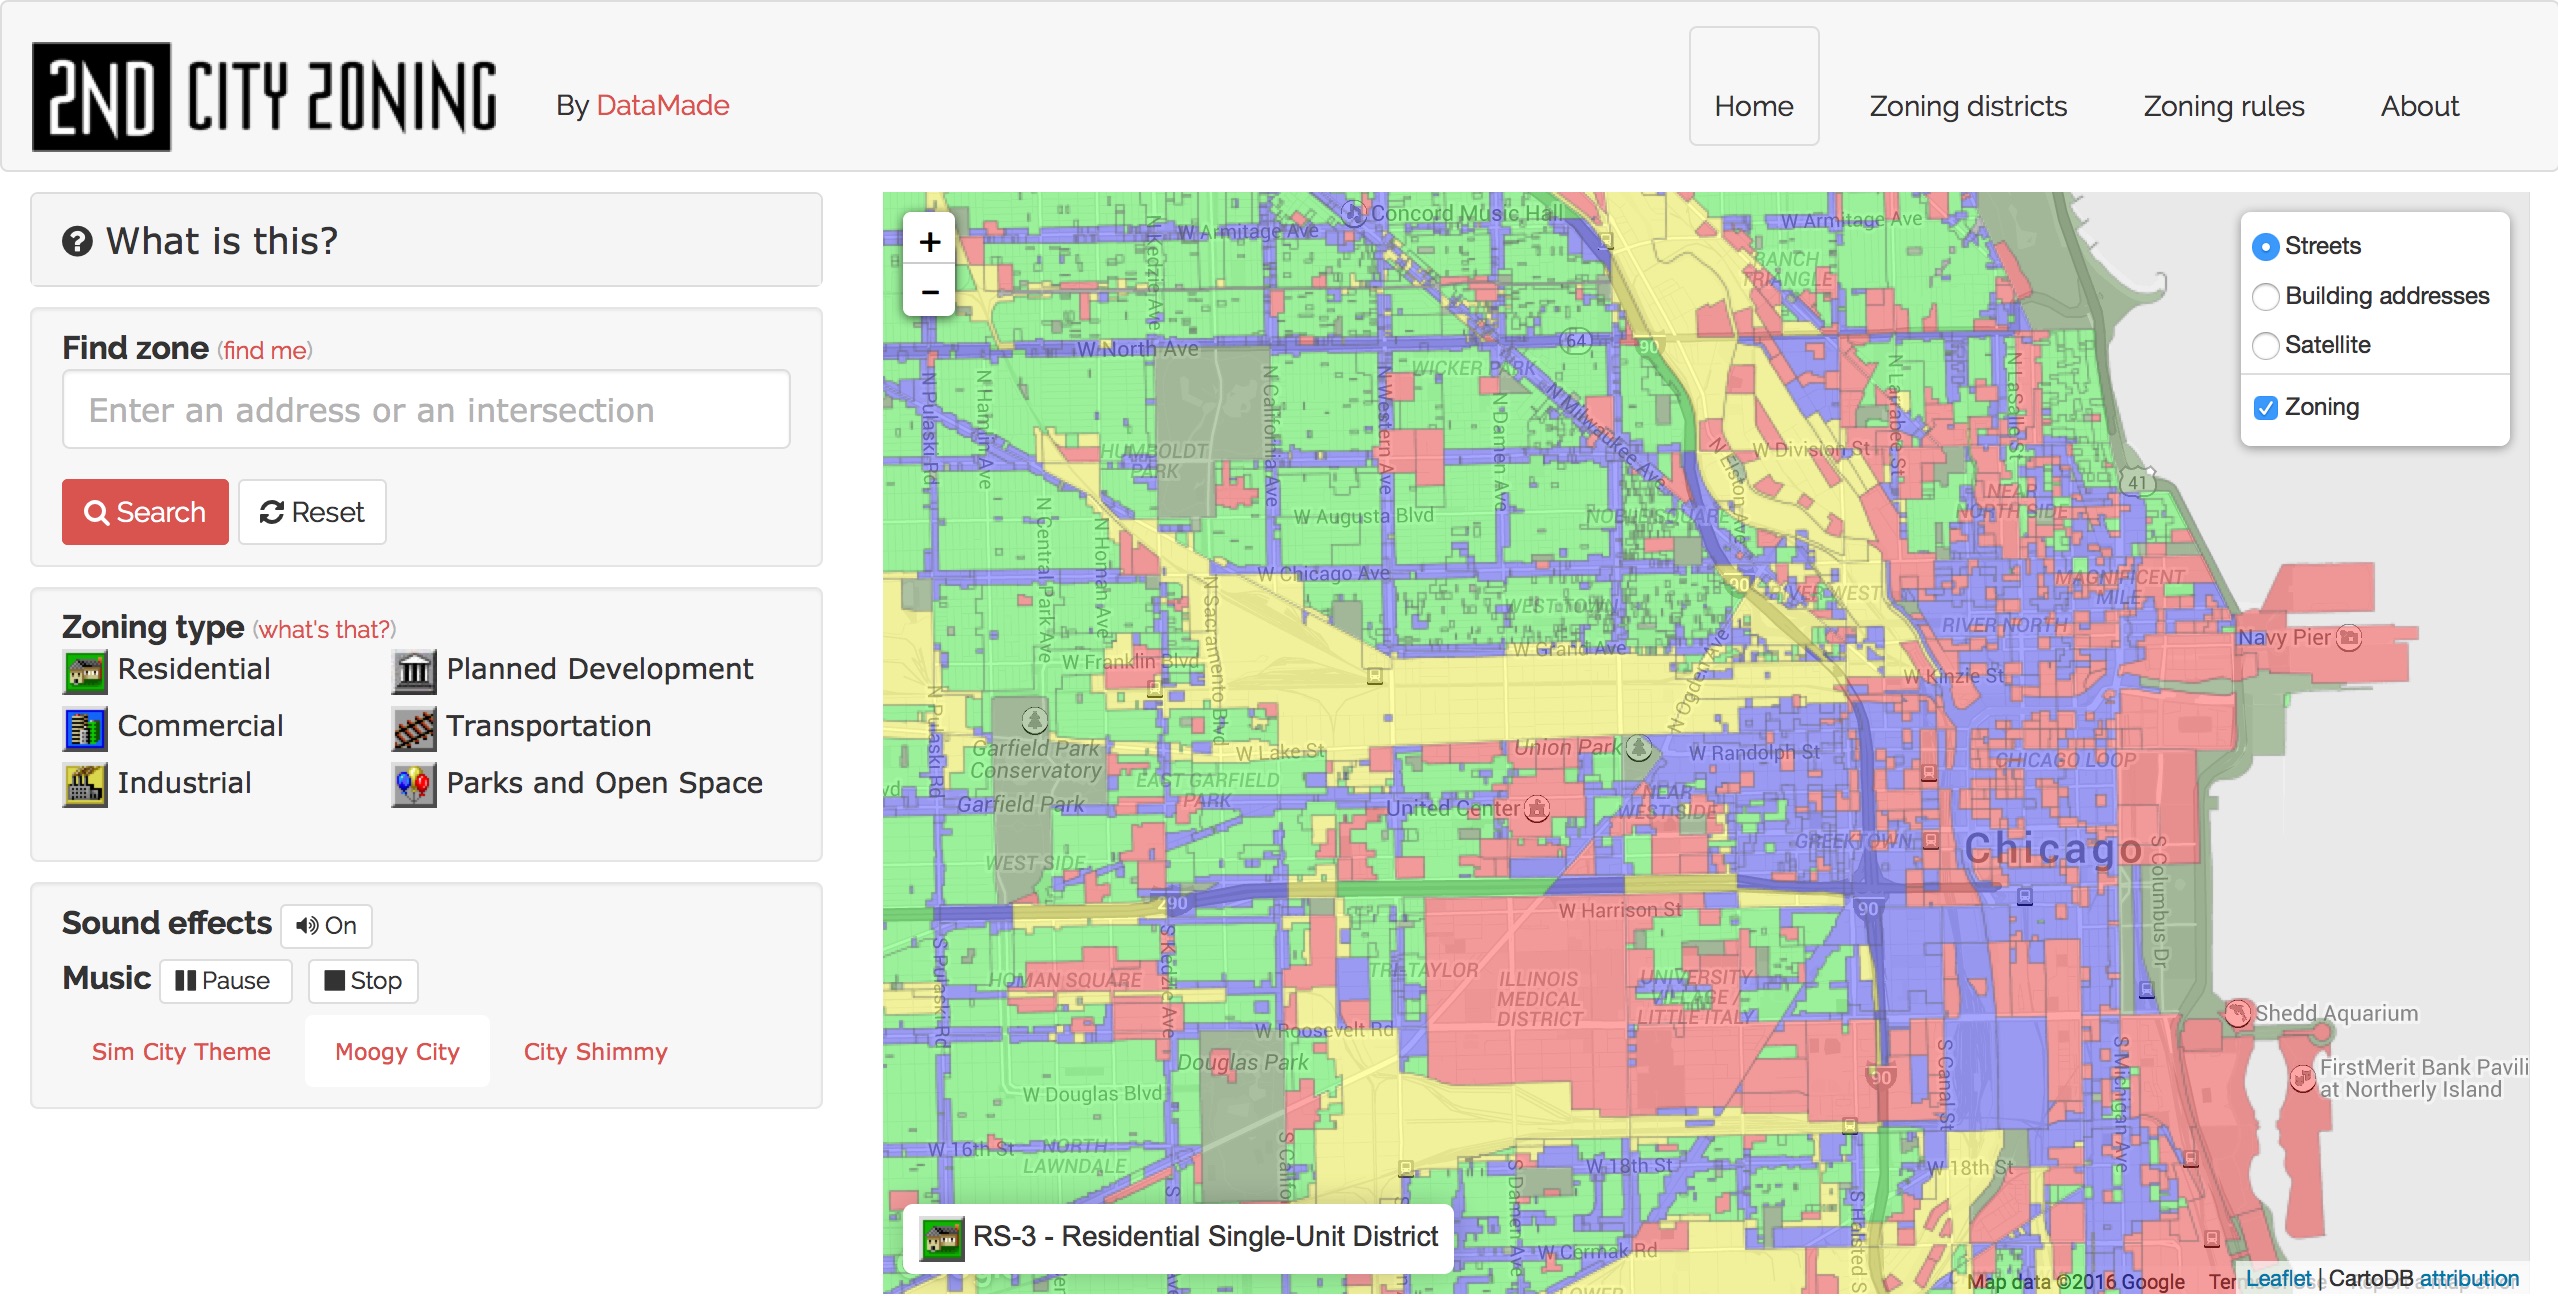
2nd City Zoning
https://secondcityzoning.org
To make Chicago’s zoning code digestible by humans, we took inspiration from one of our favorite games: Sim City 2000. Find out how your building is zoned, learn where to locate your business and explore zoning patterns throughout the city.
Press:Chicago Tonight
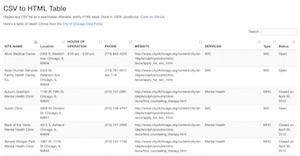
CSV to HTML Table
https://derekeder.com/csv_to_html_table
Display any CSV (comma separated values) file as a searchable, filterable, pretty HTML table.
How are people getting to work in Chicago?
https://derekeder.com/chicago_commute_modes
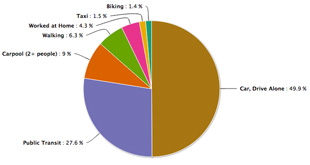
The Census Bureau collects data on how Chicagoans get to work via the American Community Survey. I created some charts to show commuting patterns for Chicago, from the S0801 table: Commuting characteristics by sex.
How's Business?
http://howsbusiness.opencityapps.org
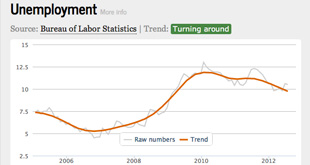
How’s Business provides a view of Chicago’s local economy. It uses open data to show how several economic indicators have been trending since 2005.
Chicago Public School (CPS) Tiers
http://cpstiers.opencityapps.org
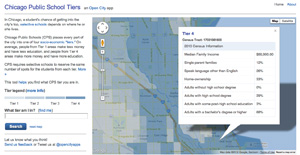
CPS places every part of the city into one of four socio-economic ‘tiers’ and requires selective schools to reserve the same number of spots for the students from each tier. Find which CPS tier you are in with this tool.
Press:Chicago Tonight
Chicago Councilmatic
https://chicago.councilmatic.org
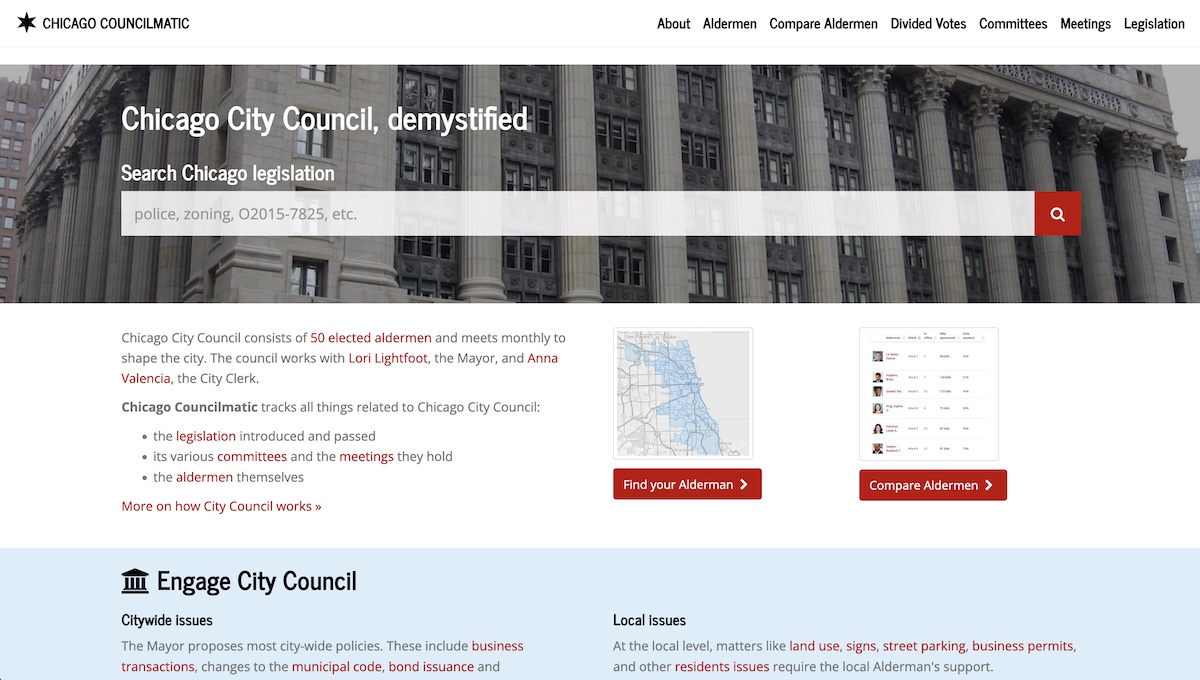
Are you curious about what legislation the Chicago City Council has been passing? Search, browse, subscribe and comment on everything the City Council has done since 2010.
Look at Cook
http://lookatcook.org
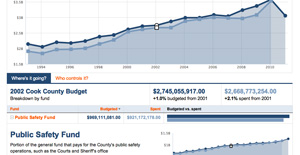
Budget transparency visualization for Cook County, IL displaying all county departments broken down by fund and control officer from 1993 to 2011. Done as a collaboration with 12th District Commissioner John Fritchey. Built with Fusion Tables and jQuery.
Press:O'Reilly Radar
ClearStreets
http://clearstreets.org
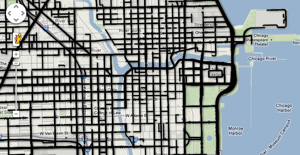
The City of Chicago launched Plow Tracker, an app that tracks the city’s snow plows in real time. This app uses the same data. By knowing where the plows are, we’ve figured which streets have been plowed.
Press:Chicago Tonight
Chicago Tribune
Grid Chicago
(Inactive) Chicago Lobbyists
http://chicagolobbyists.org
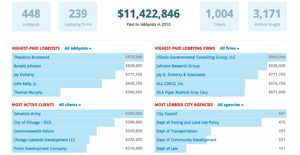
An open data, open government, and open source project intended to improve the transparency of interactions between the City of Chicago and lobbyists and their clients.
Press:City press release
(Inactive) Searchable Map Template with Google Fusion Tables
https://derekeder.com/searchable_map_template
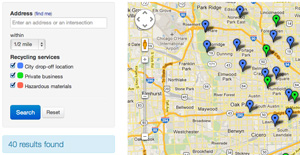
Put your data on a searchable, filterable map. This is a free, open source tool and template powered by Google Fusion Tables. This template no longer works Google shut down Fusion Tables on Dec 3rd, 2019. This template no longer functions.
Email signup • derek@derekeder.com • © 2026 Derek Eder
